Friends who play audio should know that sound signals are superimposed by sound waves of different frequencies, so it is difficult for people to avoid frequency problems when analyzing sounds. Enthusiasts often say that "there is a good curve that may not be good", but it must be noted that "the sound of a product without a good curve is definitely not good." So what is the connection between the curve and the final playback sense? We immediately got to the point and revealed the mystery for everyone.
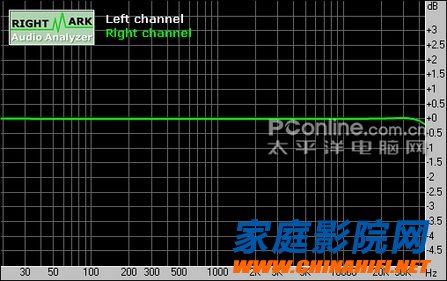
Sound card frequency response curve:
In the sound card evaluation, we often use the loop test method to test the sound quality of the sound card's input and output loops. The curve obtained is the loop frequency response of the DAC to the ADC.
Frequency response
General performance: Excellent
Frequency rangeResponse
From 20 Hz to 20 kHz, dB-0.00, +0.01
From 40 Hz to 15 kHz, dB-0.00, +0.00
The above figure and the above table are the frequency response curve and curve quality. To know what a good curve is, you should know what the ideal frequency response curve looks like. The ideal frequency response curve should be exactly the same as the input signal. Generally, we will use the equal-sound signal (the same sound pressure in each frequency band) as the input signal, so the ideal frequency response curve should be as smooth and smooth as possible. .
For the sound card, the sampling specification has two parameters, one is the sampling frequency, and the other is the sampling accuracy. The sampling frequency means that the parameter is taken several times on the received signal in one second, the unit is Hz; and the sampling precision means that each The degree of precision of the subsampling, in bits. There are a lot of different sampling methods, and the quality of the sampling is determined by these two basic parameters. However, depending on the sampling and encoding methods, the emphasis between the two is different. The highest specification of the PCM method currently used is 192 kHz/24 bit, which means that 192000 samples are sampled per unit time, and the accuracy of each sampling is 24 bits.
The above figure is the sampling result of 192 kHz/24 bit using PCM coding. In general, as sampling specifications increase, the curve becomes relatively more ideal without increasing the hardware level. We can see that the curves are quite straight from 20Hz to 30kHz. The following transcripts also list the test parameters. The curve change from 20 Hz to 20 kHz is only -0.00, +0.01 (dB); while 40 Hz to 15 kHz is more ideal, no distortion is detected within the accuracy range. Is a fairly ideal frequency response curve.
The frequency response curve of the speaker:
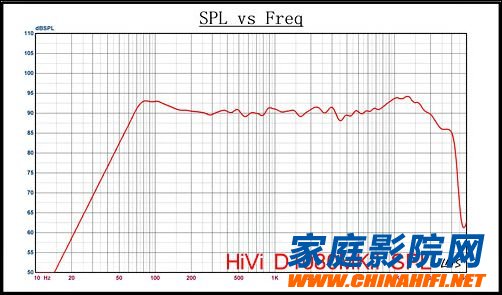
The frequency response curve of a general speaker is a sound signal collection and drawing by the LMS electroacoustic test system. Since the speaker is converted from an electrical signal to an acoustic signal and then collected by the LMS and converted into an electrical signal, and due to the nonlinearity of the speaker and the amplifier, the curve is difficult to achieve the same frequency response curve as the sound card. But their requirements are similar, and the frequency response curve should be as smooth and straight as possible.
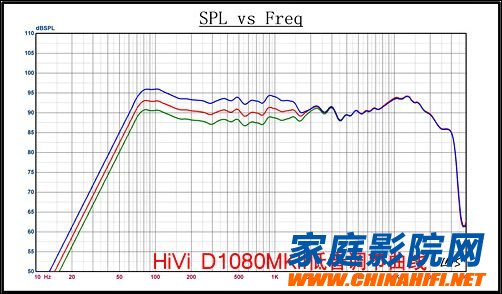
The above picture is the frequency response playback curve of a product. From this curve, we can see that the speaker frequency response with an average sound pressure of about 90dB is ideal. The curve in 200Hz~5KHz is relatively straight, and in order to obtain a brighter high pitch and a fuller low frequency, the speaker beneficially increases the gain at both ends, which is also the performance of different speaker manufacturers' final style appeal.
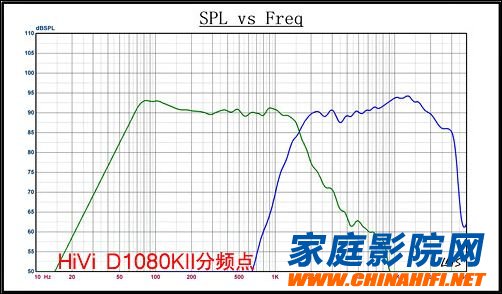
The two-way speaker can also test the frequency response through the unit to get a more detailed reference curve, which can help us judge the relationship between the two units of the speaker product. In general, the treble part should be able to attenuate the excess frequency as soon as possible after passing through the crossover point (so that the mutual influence between the units can be avoided as much as possible). After the curves of the individual tests are superimposed, they should be as close as possible to the overall frequency response curve (it can be judged that there is basically no obvious mutual influence when the two units work at the same time).
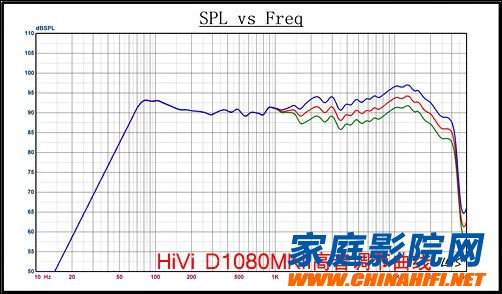
From the above picture, we can see the crossover point setting of the product. The crossover point of this speaker is about 1.7kHz. The most sensitive part of the human ear is about 300 to 1.2 kHz. In order to get a better sense of hearing, the two-way speaker usually sets the crossover point at twice the upper limit frequency of the most sensitive frequency band, that is, Mostly around 2.5kHz. This can reduce the requirements for tweeters. Lowering the crossover point places higher demands on the crossover and tweeter. Based on this, we look back at the overall frequency response. It can be seen that the fluctuation of the sound is controlled to be ideal in this frequency band, and there is basically no significant excessive frequency point attenuation.
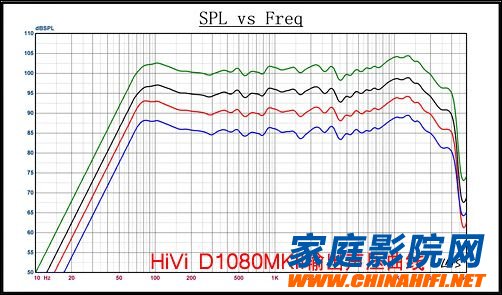
Through the curves under different sound pressures, the stability of the playback quality of the speakers can be expressed. Generally speaking, there is no obvious change in the playback sense of the speakers under different volume levels. The above picture is the test curve under different sound pressures. This comparison method is also a common method for discussing speaker quality. We can see that even if the sound pressure is increased to 100dB, the frequency response curve of the speaker has no obvious deformation. It can be said that within this range, the influence of the volume adjustment on the sound can basically be regarded as linear (that is, More ideal).
Adjust the frequency response curve of the bass gain separately
Adjust the frequency response curve of the treble gain separately
The perfect two-way speaker provides the ability to adjust the high and low sound separately. The above two figures describe the frequency response curve of the speaker after adjusting the treble or bass gain separately. The method of judging the pros and cons is similar to the case of increasing the sound pressure gain, which we will not repeat here.
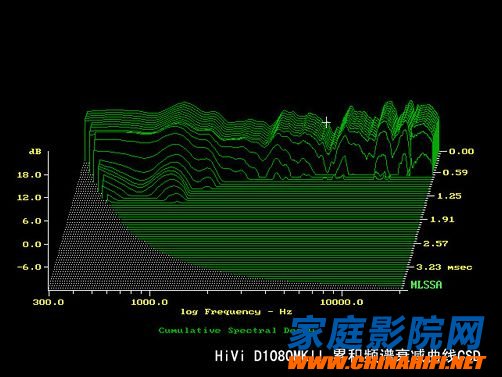
There are many factors that affect our final sense of hearing. A simple frequency response curve does not fully describe the characteristics of sound playback. Because the sounds people hear are superimposed signals of direct and reflected sounds. The sound spectrum attenuation curve is a good reflection of the sound characteristics of real life.
The above picture is a cumulative attenuation curve of a sound, which is a three-coordinate surface, so it presents a stereoscopic picture. The three parameters are sound pressure, frequency and time, which reflect the sound after different times. Residual amount of each frequency band in a fixed space. From the above figure, we can see that after a period of time, the most residual is the low frequency signal.
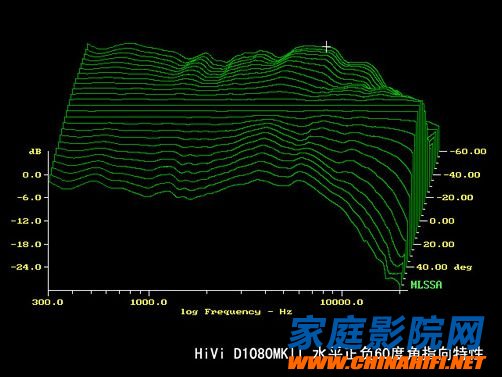
The pointing characteristics of the speaker are related to the sound field size, width and depth of the sound during the stereo playback, the sound level of the sound image, the sound level, the detail positioning, etc., which is one of the main metrics for evaluating a speaker. The test method is similar to the cumulative decay curve, with a three-coordinate surface to reflect the directional characteristics of the speaker.
The three parameters are the sound pressure value, frequency and deviation angle. By rotating the speaker deflection angle, the sound pressure changes of the frequency bands of the speaker at different deviation angles are measured. In general, the smoother and slower the sound pressure changes, the better.
From the current experimental field, the study of acoustics is not limited. Even if the approximate frequency characteristics of the sound are drawn, it does not necessarily represent all the features of the sound. Most of the current quality research fields can only start with frequency. From a large number of experimental results, even if "a good curve does not necessarily make a good sound", but "the product sound without a good curve is definitely not good enough", so the method of evaluating the sound quality of the product based on the frequency waveform is still feasible. Sexuality and objectivity, with its help in our subjective judgments, can correct as much as possible the errors we produce due to subjective factors during audition. More home theater technical information, all in China's home theater network, official WeChat: cnhifi.
3 Charging modes Available for Different Phones 7.5W charging mode is for iPhone 11/11 Pro/11 Pro Max/XS MAX/XS/XR/X/8/8 plus with latest iOS System; 10W charging mode is compatible with Note 10/10 Plus/S10/S10 Plus/S10E/Note9/S9/S8 and so on; 5W charging mode works on Any Qi-enabled devices like Google Pixel 3/3XL/4XL and other Qi-enabled phones. Note: Adapter is Not Included, QC 2.0/3.0 adapter, iPhone 11 Pro /11 Pro Max PD Adapter, Note 10/10 Plus PD Adapter will be highly recommended.
Unique Design Perfect for AirPods:It is compatible with AirPods (with wireless charging case) and AirPods Pro. The size of the AirPods fits perfectly into the charging area of the wireless charging pad, perfect wireless charging companion for AirPods, easier to find the [Sweet Spot". Also, both top and bottom have a rubber ring, will keep your AirPods in place and prevent slippage.
Safer and Easier to USE:Exclusive Multifunctional Intelligent Protect Technology provides temperature control, surge protection, short-circuit prevention. Besides that, this wireless chargers is Qi-certified, made of ABS Material which is fire-resistant, and has a UL Certificate, you can purchase it at assurance. Double guarantee and dual safety provide you safety experience. To get better experience, we would like you to take off the phone case and use the adapters recommended (NOT INCLUDED).
More User-friendly Design:SLEEP-FRIENDLY DESIGN. The GREEN LED Indicator will flash for 3s if power source is connected, then turn on for 16s if recognizes your phone well. Entering charging mode, light will turn off and keep the whole charging process SLEEP-FRIENDLY.
Wireless Charger,Fast Wireless Charger,Smart Wireless Charger,Wireless charger of fast,Wireless Charger for 3 Charging modes
Dongguan City Leya Electronic Technology Co. Ltd , https://www.dgleya.com