As virtualization and cloud technologies become more mature, the cost and architectural advantages of distributed systems are becoming more prominent. In particular, design concepts such as microservices are becoming more and more popular in business systems, especially large Internet companies. The more complicated it is.
With the expansion of services and the splitting of services, the modules of the system become more and more, and different modules may be maintained by different teams/programmers. A customer's business request may involve the collaborative processing of several or even dozens of services, involving multiple team/programmer maintenance modules, different caching, database, message queue and other middleware. Under such a cloud application architecture, any request for a link failure or performance problem will seriously affect the user experience of the service. How can I quickly and accurately locate the root cause of the fault? How to capture performance bottlenecks in requests and implement optimization? How do you correlate discrete business request data for effective user experience analysis? For large, high-traffic websites, social, e-commerce, and gaming applications, such issues are particularly acute, directly affecting end-user perception and retention of the system.
The traditional application operation and maintenance problem is mainly based on logs. Through the analysis of alarms, system resources, and logs, the fault root cause or performance bottleneck is located. However, due to the complexity of the cloud architecture and the diversity of service request links, the traditional application operation and maintenance mode cannot continue to support the requirements of fault location and performance analysis. This time you need the APM system to show your talents.
Definition and evolution of APMAPM (ApplicaTIon Performance Management) is application performance management and belongs to the category of IT operation and maintenance (ITOM). It mainly monitors and optimizes the IT application performance and user experience of key business operations, improves the reliability and quality of enterprise IT applications, ensures users get good services, and reduces IT total cost of ownership (TCO). With the development of the Internet, APM has gone through the following three stages:
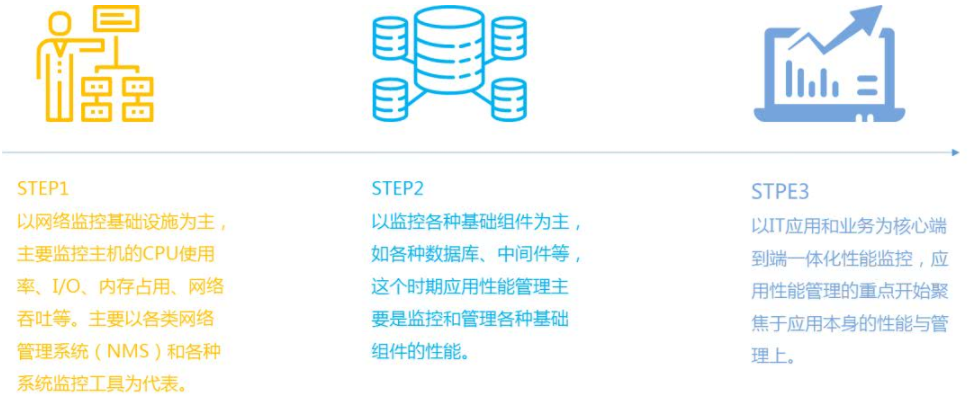
The first phase of APM emerged in the early days of the Internet . Due to the generally poor level of network infrastructure, application speed is very sensitive to network speed and performance of basic resources. At this stage, APM is network-centric and considers network speed as the application speed. APM mainly monitors the CPU, I/O, memory, and network throughput of the host.
The second phase of APM is based on monitoring various basic components . With the development of the Internet, network applications have become more and more complex, and various basic components have become more and more, which has prompted APM to enter the health status and availability of IT components. Performance monitoring is the second phase of the center.
In recent years, the rapid development of technologies such as mobile Internet, cloud computing, big data, and Internet of Things, various business applications have emerged, the complexity of IT applications has exploded, and the "user-first" nature of Internet products has determined that user experience has become The key factors for the survival and development of various Internet products. How to improve the user experience, ensure the reliability and stability of services and products, optimize services, etc., put forward new requirements for application performance management, application performance management into the user experience as the core, focus on business transactions and application architecture high complexity The third stage.
Based on APM market analysis, Gardern made a new definition of APM:
Under the new standards, the APM market is growing rapidly. By monitoring and managing the performance and availability of application services, APM helps application/service developers discover and locate performance bottlenecks and failures to ensure that applications meet the expected service levels and end-user experience.
Principle of distributed tracking technologyModern APM is basically implemented with reference to Google's Dapper system. Dapper tracks the performance consumption of the application system in the front-end processing and server-side calls by tracking the processing of the request. Google published a paper "Dapper, a Large-Scale Distributed Systems Tracing Infrastructure" based on Dapper's implementation, which provides a valuable reference for the implementation of distributed tracking in the industry. The paper has also become the theoretical basis of the current distributed tracking system. . You can refer to the original Dapper paper for detailed understanding. This article only briefly introduces the principle.
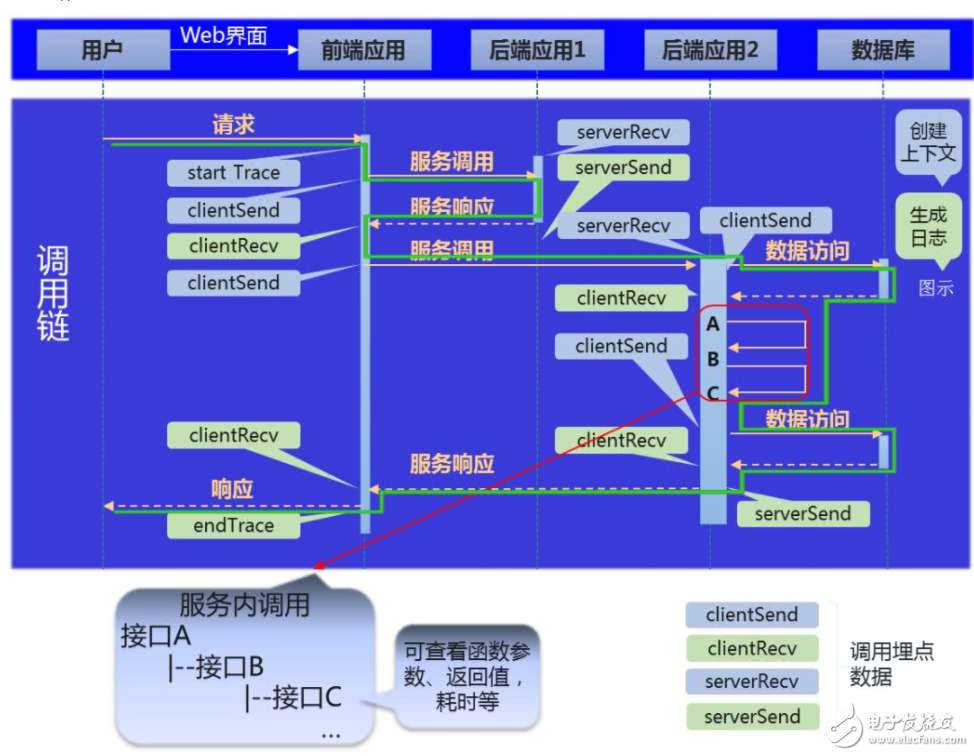
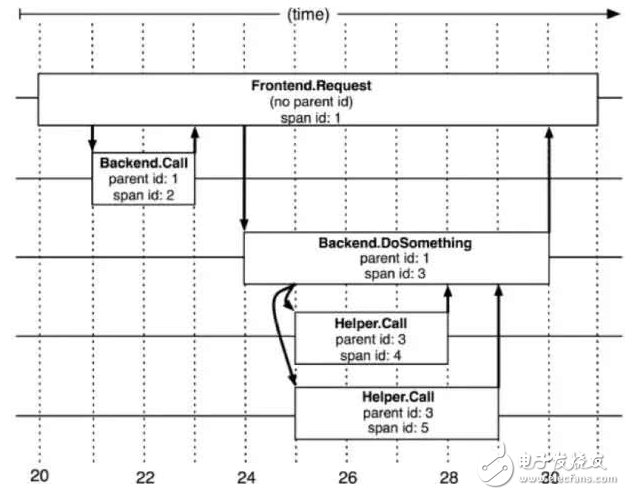
As shown in the figure above, for each request call in the service chain, it is divided into clientSend (client sends request), clientRecv (client receives response), serverRecv (server receives request), serverSend (server sends response) Wait for four events and organize them into a data structure called Span. By defining the call (parent-child) relationship between Spans, the discrete Span data can be reorganized to restore the complete call chain. The relationship between Spans is identified by traceId, parenTId, and spanId. The traceId is the unique identifier of a complete call link, the parenTId identifies the previous call to the current Span, and the spanId is used to uniquely identify a call. The relationship of Span in the tracking link can be represented by the following figure:
Based on Google Dapper's idea of ​​restoring the original link through traceid, parenTId, and spanid, many large Internet companies have developed their own call tracking systems, such as Twitter's Zipkin, Taobao's Hawkeye, Jingdong's Hydra, and open source PinPoint. Although the ideas are consistent, there are some differences in the choice of implant points.
Two major genres of distributed tracking acquisition technology
The application performance management system is mainly composed of data source, acquisition and transmission, analysis and calculation, and visual query. The most core part is the data source. Through the data collection from the client and the server, the data collection technology of the client mainly includes the active dial test and the passive buried point probe. The detailed description is not provided here. This paper mainly introduces the data collection technology of the server.
The data collection on the server side is mainly divided into two categories:
• Network Bypass Monitoring , which performs application performance analysis by fetching application access traffic through a switch or network interface of the production network deployed by the application or service. This approach has little intrusiveness to applications or services and has little impact on performance. However, this method has a large collection size and cannot provide code level problem location, and under the secure transmission protocol, it cannot analyze the request or thing.
• Probe burying points , application performance data collection by deploying or embedding probes on the production server. This approach provides very complete and fine-grained monitoring data collection, providing code-level problem location. However, this method is intrusive for the application. If the buried code is abnormal, it will have an impact on the performance and stability of the application itself.
In buried data collection for applications and services, the way in which the probe is buried is mainly used. The way in which the probe is buried is mainly divided into two types, the code intrusive buried point represented by Zipkin and the bytecode enhanced buried point represented by PinPoint.
Zipkin and invasive collection do not rely on framework ecological maturity
Zipkin is Twitter's open source distributed tracking system. Users help microservices collect time-series data for troubleshooting potential problems, providing the ability to collect, store, query, and analyze dependencies. Zipkin is a distributed tracking system that does not have features such as user experience analysis and application monitoring statistics. Zipkin uses code to invade the way, and officially provides a buried point solution based on the Finagle framework. Support for other languages ​​and frameworks relies heavily on community contributions. Current support includes mainstream languages ​​and frameworks such as Java, Scala, Node, Go, Python, Ruby, C#. Code intrusion point refers to the use of developer calls by providing an SDK for application development, or providing a framework for integrating embedded code. Some enterprises with framework research and development capabilities will be embedded in the development framework or communication framework like Google, ensuring that applications based on unified framework development or communication have the ability to bury the point naturally, and there is no need to pay attention to the implementation and call of the embedded point except the framework development team. the way. The advantage of this buried point method is that the use of the frame does not require additional attention to the buried point capability, and the cost of the buried point is reduced in disguise. Twitter's Zipkin and Taobao's eagle eye chose this way of burying.
At the same time, the industry also has a large number of buried point equipment libraries, supporting the use of buried point components to achieve the call chain data buried point. This way of burying, based on the standard service framework, such as: Servlet, Spring MVC, Http Client and general middleware, such as MySQL, Kafka, etc., by writing simple code and configuration, based on these standards The application built by the framework can output the call chain report data. Brave offers a number of standard framework implementations for this buried approach. It also provides a very simple and standardized interface to support customization and expansion when the above package implementations fail to meet business requirements.
The code intrusion buried point has better scalability, and is convenient for the user to customize the data type and level of the collection. However, regardless of the way in which the framework is buried or the way to provide the equipment library and SDK, code intrusion is required. In the application development and framework upgrade scenarios, the application needs to re-edit the code. At the same time, it is difficult for application developers to accurately identify where they need to be buried, and the level of tracking based on code intrusion is low, and it is impossible to obtain enough detailed operational status information.
PinPoint and bytecode enhanced acquisitionDeep burying point to achieve non-intrusion
Unlike Zipkin, PinPoint is an open source application performance management (Application Performance Management) tool that uses bytecode enhancements for data source collection. Currently only the official Java Agent probe is available. Bytecode enhanced burying mode, advocating code non-intrusive, different programming languages, embedded in language running environment or base library by different technologies. For Java applications, bytecode enhancement technology is used to cover different communication protocols, middleware, and development frameworks through different plug-in plug-ins when starting the JVM, and to perform function level burying on the Java base call code. The advantage of this buried point method is that it can get the stack level call information and other more running status information, helping the user to quickly complete the problem location without the aid of logs and other auxiliary means.
PinPoint uses bytecode enhancement technology for APM data acquisition. By configuring the java agent probe at the startup of the application, it actively intervenes in the application code behavior. The application developer does not need to modify the code. PinPoint determines which APIs to bury data. . Compared with PinPoint's bytecode enhancement technology and code intrusion embedding of other APM systems, bytecode enhancement technology can theoretically be buried anywhere, similar to the intrusive buried point of the Brave equipment library. The way itself depends on the implementation of the middleware, and the application-level API provided by the framework also needs the support of the underlying driver of the framework to achieve interception.
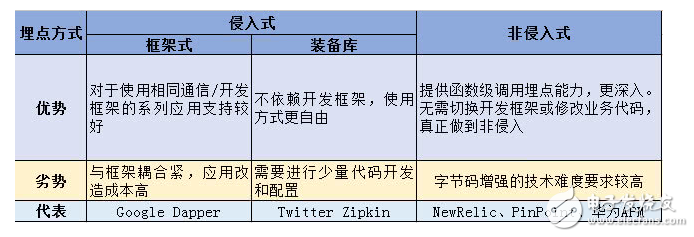
PinPoint has been designed with performance optimization in mind, such as using Thrift's binary variable length encoding format, using UDP as the transport link, using data reference dictionaries when passing constants, and using asynchronous transport. However, there are still some performance problems and constraints, and because bytecode enhancement technology has higher requirements for developers, it has certain disadvantages in terms of scalability and community ecology.
Huawei APM's technical practice zero-invasive full-cycle careHuawei APM combines the advantages of both PinPoint and Zipkin systems to provide a more convenient, efficient, and cost-effective solution.
1. Non-intrusive data collection: one-click acquisition and deployment, more efficient and robust data collection capabilities
Huawei APM probes take advantage of PinPoint acquisition probes, optimize data acquisition models, output component performance, reliability, etc., and count the extensive use of frameworks and middleware in the industry to increase plug-in support capabilities. To ensure the most useful performance analysis data for users with minimal resource consumption.
· Automatic probe deployment: Huawei APM supports the use of Huawei cloud container engine and cloud application orchestration services. It can be automatically deployed during application deployment by simple check.
· Support for the Zipkin model: Although both PinPoint and Zipkin are based on Google Dapper's paper, the theoretical basis is roughly the same. But there is still a big difference in the data model of the call chain. Zipkin has an edge in terms of openness and community activity. To support Zipkin user access, the Huawei APM probe supports call chain data output in accordance with Zipkin's data model.
· Data classification optimization: For APM call performance statistical analysis (throughput, average delay, TPN, etc.), the industry-wide way is to use the call chain data for secondary extraction and aggregation. In this mode, you need to call as many chain data samples as possible to make the statistics as accurate as possible, which will inevitably consume more application resources. To solve this problem, Huawei APM probes classify the collected data sources: call chain data and KPI data. The KPI data is aggregated according to the cycle for each business request, and the output includes information such as the request originator, the requesting service party, the calling transaction, and the calling state (time-consuming, successful or failed). Since the KPI data is periodically output and compared with the call chain data, the full amount of request acquisition and statistics can be realized under a small resource load.
· Accurate data collection: Call chain data pays more attention to call timeout (threshold supports customization) or call the exception call chain. Based on the basic sampling rate, Huawei APM triggers the actual operation and maintenance of the customer and provides accurate acquisition and dynamic configuration. Accurate acquisition supports customers to set timeout thresholds for application or transaction transactions, periodic collection of abnormal call samples, and normal call samples during the cycle to reduce resource consumption while ensuring that data samples for exceptions or timeout requests meet performance analysis requirements.
· Data transmission optimization: For the problem of high resource consumption of data output under large data volume, the output component is optimized, and the application resource is optimized by asynchronous file output and asynchronous pipe output, output data cache, and data type reduction. .
· Collecting the escape mechanism: In the high concurrent peak scenario, the application service request is large and the resource consumption is large. At this time, Huawei APM supports the user-defined configuration of the escape resource threshold to ensure normal service running. After the application resource consumption reaches the threshold, the Huawei APM probe actively stops all operation and maintenance data collection, and automatically restores data collection when the resource consumption falls below the threshold. The escape mechanism supports dynamic configuration.
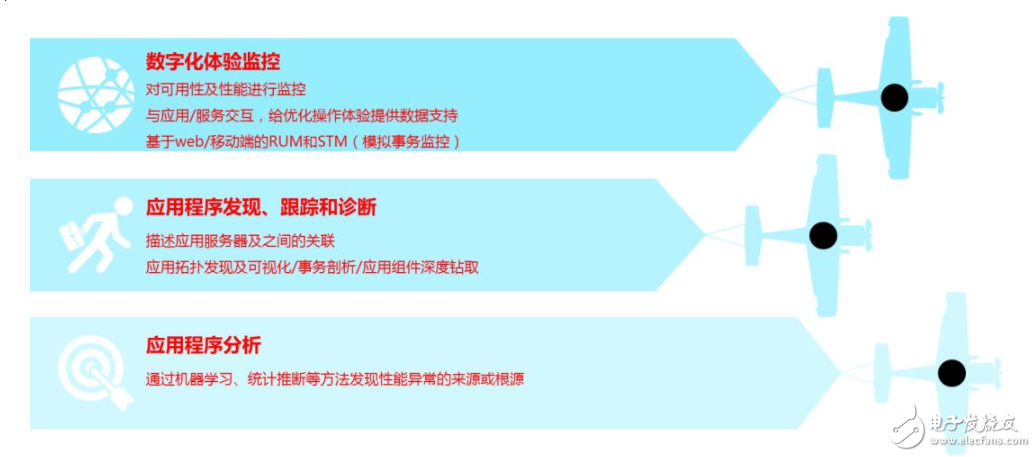
2. Digital operation: providing business operation experience management and performance analysis
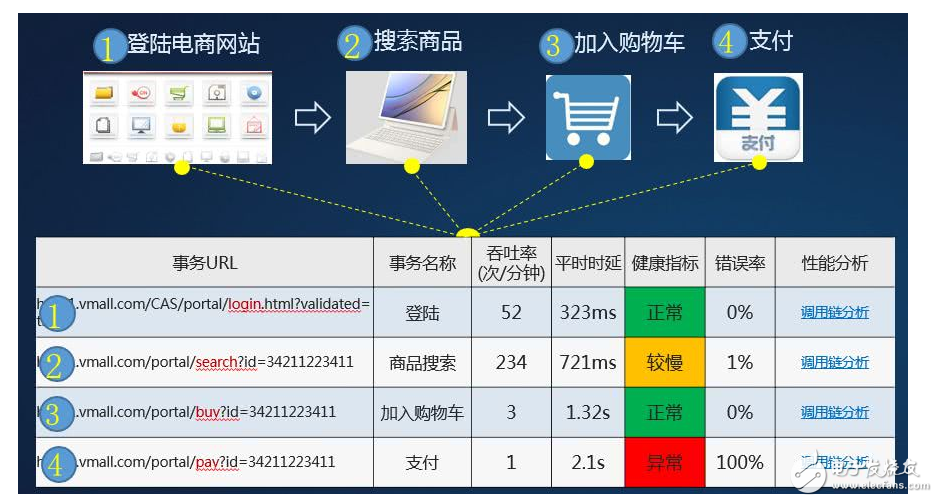
Track every business transaction in real time, quickly analyze the running status of the transaction and provide diagnostic capabilities
· Custom transactions: Users can define transaction names based on each URL for easy understanding.
· Health rule configuration: Health rules can be configured for each transaction, such as more than 1s prompt exception.
· Performance tracking: Accurately collect abnormal performance data, compare historical baseline data, and find application anomalies to improve operation and maintenance efficiency.
3. Application analysis: application relationships and exceptions at a glance, fault drill down
· Application discovery and dependencies: Accurately collect abnormal performance data, compare historical baseline data, and find application anomalies to improve operation and maintenance efficiency.
· Apply KPI aggregation: The micro service instances are aggregated to the application, and the KPI data is automatically aggregated to the application.
4. Application Tracking: Tracking the abnormal business call chain, fast problem demarcation
Support platform, resource, application monitoring and microservice call chain analysis:
· Massive data scale support: support for million container monitoring, second level query response.
· Fault drill down: You can drill down to the faulty microservice instance by clicking the fault node, or you can link to the failed call chain and call stack to see the input and return values ​​of the failed function.
Wifi 5 Ceiling Wireless Ap,Wifi Access Point Poe Ceiling Mount,Ceiling Mount Wifi Access Point Home,Access Point Enclosure Ceiling
Shenzhen MovingComm Technology Co., Ltd. , https://www.movingcommiot.com